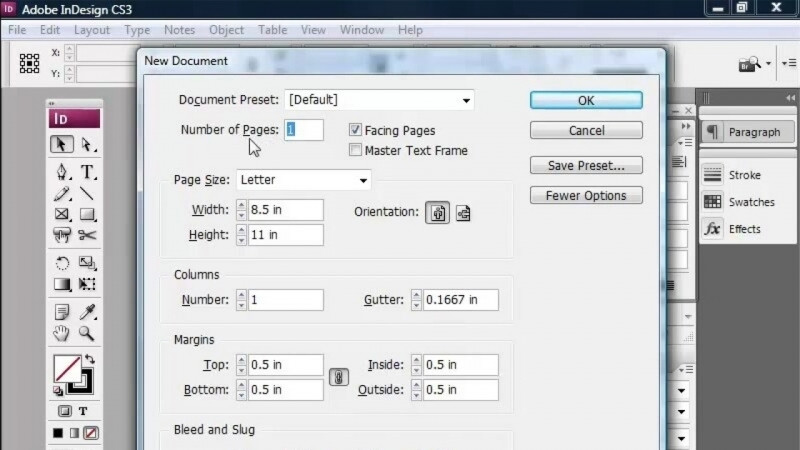
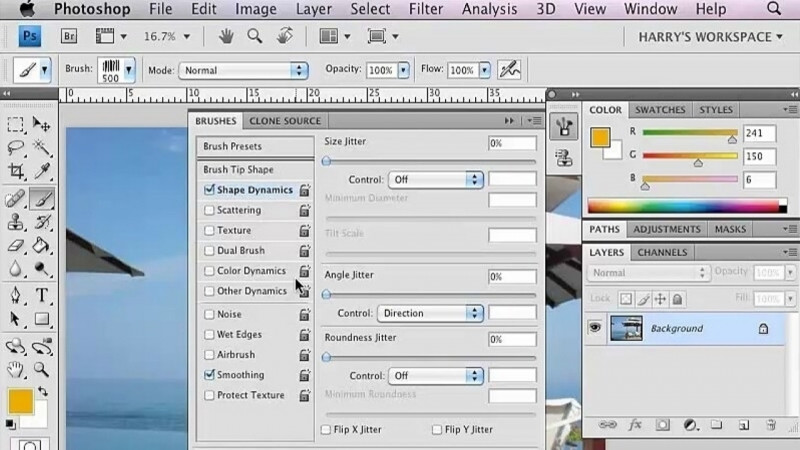
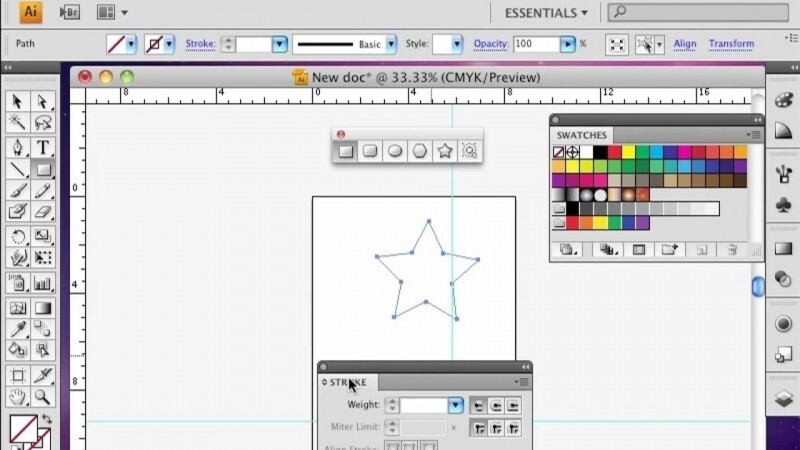
Hello, my name is Mike Collins. In this lesson you'll learn how to create and edit custom tables, charts and infographics in Adobe InDesign. Let's open the InDesign application and create a new document that is letter-sized in a portrait format. We'll go ahead and use the default here to create our table in. Now we'll quickly look at several ways to create a table. Then get into more advanced table editing later. One of the easiest ways to create a table is to draw a text frame and then select it, book to your top menu, choose Table and Create Table. And the Create Table panel that now opens allows you to choose how many body rows, columns, header rows and footer rows you'd like your table to have. You can also choose a table style with no table style, a basic table or create your own new custom table style and we'll talk more about creating styles later on. For now let's create a table with 12 rows and 3 columns, no header rows or footer rows and click on OK. You can also create a table without first creating a text frame that gives you a loaded text cursor which is what we have now as we see on the screen and we'll place it wherever we like on the screen in our layout. Now we can add or remove rows by grabbing the last row, click on it and pull up or down while holding the Option key on a Mac or Alt key on a PC. And you can see we can remove the rows we want. If I want to add a column I'll place my cursor inside of the column, right click and select Insert, row or column. We can choose the number of or the one who will left or right and click OK. Now because the table was already sized to fit into the frame we're going to have to resize it and one way to do this is to click on the side of the table, select it and drag it back to fit into the frame. You can also double click on it and adjust any of the rows or columns you like by resizing them and placing them where you want. But now to get everything in the same scale we can double click on the table and the cursor will change to a bold arrow on the side or at the top left corner, click and now you can see you've selected the entire table. Now if you right click with this whole table selected you can select distribute rows evenly and distribute columns evenly and the cells in the table will be equally spaced. You can also select rows or columns, right click on them and you can insert more, delete or select whatever you'd like, you can also merge them, you can also just select some of the rows or columns, adjust the size, right click and then equally space them just to have a portion of your table be a different size. Go ahead and select those cells, right click and you can distribute them evenly. Now you've got a table with larger cells on top and smaller cells on the bottom. And Design gives you a lot of options to custom edit and stylize your table. Let's say we want to add color to headers at the top of our table, we'll select the top cells and then go up to window and color and select swatches. And you can choose whatever color you like and we can choose our tint, in this case let's take a down to 50. Now you'll notice the color is inverse until you deselect it. Now we can add whatever text we want to the top of our table. In this case we can put our column, now we could also just copy and paste these but we're going to be modifying these in some different ways. So we can select our cells, we can select the text and center it. We can also center it as we just did a horizontal but if we choose this we can align the center at the bottom, center or top, in this case we'll align the center and let's increase our font size and we'll give it a little different font type and let's keep it at regular for now this looks good and we'll click off of it. Now we have colored cells with our text in them centered as we wanted them in each cell. We could also modify if we choose the cells, we could modify for example the stroke and we can go in later and decide how we want to handle the stroke, we can choose whether we want certain portions, certain lines to be highlighted and increased in size or not. Now let's look at some other table styles. If we want to make sure all the cell sizes are the same we can create a new table style so go up to windows and select styles and table styles. We can select table style and double click on a new table style and rename it if we like. We'll call this one new table style one. You can also right click on the table style to open up the dialog box with several options. We can experiment with the table set up your row column strokes fills, you can also apply paragraph styles to any cells. Go ahead and explore these and see what options you've got. We have table set up, we have row strokes, we have column strokes and we have fills and any one of them will give you all kinds of different options to customize your table to whatever unique need you have. In design also works with charts and infographics like a pie chart, bar chart or ring chart but in truth it is much easier to design and create them in another program like Adobe Illustrator or Photoshop and then import them into InDesign. While the InDesign application is a wonderful layout tool and has its place in the wonderful Adobe family, especially in publishing, other applications are more robust for illustration and graphic designs and would probably be easier to use to create them. The good news is that the InDesign table feature works wonderfully with imported graphics and you can place them wherever you like and then add text and color to highlight whatever information you want to show. We will discuss a few of InDesign's tricks in the advanced course. Now you've learned how to create and edit custom tables and a little bit how to work with charts, infographics and Adobe InDesign. Stay tuned for the next lesson where I will show you how to format cells and text, align an inset text within the cell and format text by column in Adobe InDesign. Thanks for watching.